Search -
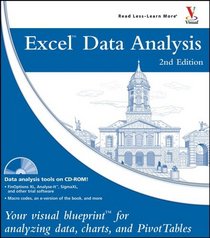
Excel Data Analysis: Your Visual Blueprint for Analyzing Data, Charts, and PivotTables (Visual Read Less, Learn More)
Excel Data Analysis Your Visual Blueprint for Analyzing Data Charts and PivotTables - Visual Read Less, Learn More
Author:
Excel is a spreadsheet / data analysis tool attached to the Microsoft Office suite and is available in all Office offerings. Office holds 80-900f the market share for productivity suites. Though many consumers know the basics of using Excel, they may not know the full power of the program. With Excel, you can harness the power of your data, mani... more »
ISBN-13: 9780764597800
ISBN-10: 0764597809
Publication Date: 5/27/2005
Pages: 301
Rating: ?
ISBN-10: 0764597809
Publication Date: 5/27/2005
Pages: 301
Rating: ?
0 stars, based on 0 rating
Genres:


